Episode 6 - Can A Drunk Conversation Predict A Recession?
Released Friday, 12th April 2019
Good episode? Give it some love!
Episode 6 - Can A Drunk Conversation Predict A Recession?
Episode 6 - Can A Drunk Conversation Predict A Recession?
Friday, 12th April 2019
Good episode? Give it some love!
Rate Episode

Show Notes:
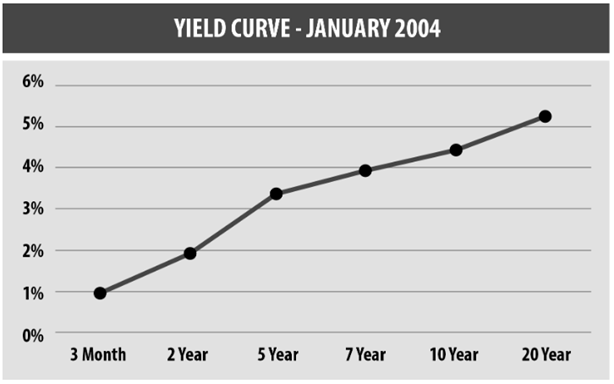
January 2004 was a time of great economic growth in the US. As you can see in the chart, there is a slight concave curve and a positive slope.
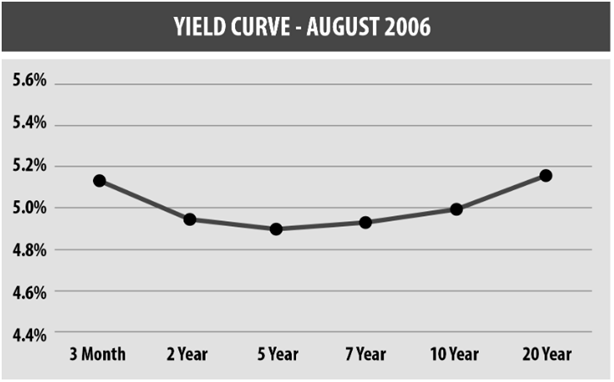
In August of 2006, the yield curves had inverted, showing a convex shape. The economy had not been impacted yet; however, The Great Recession was less than 18 months away.
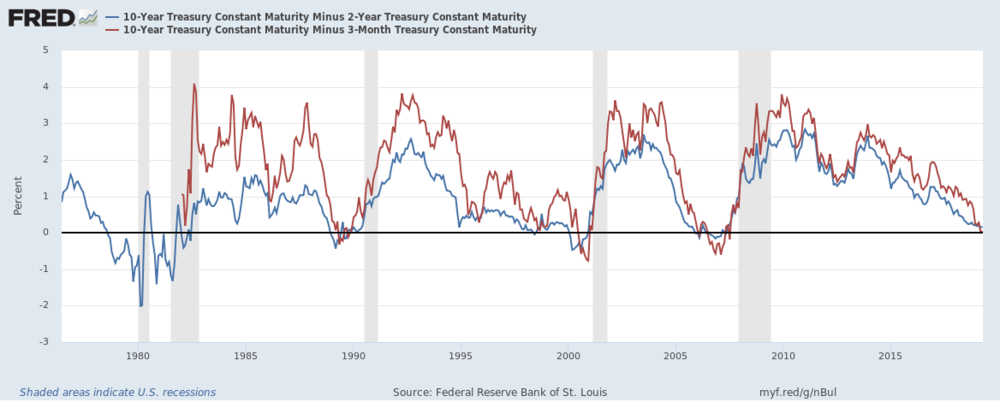
Source: https://fred.stlouisfed.org/graph/?g=nf0p
This graph shows the 2 year and 3 month yield curve spread over time. The shaded areas are US recessions.
Show More
Rate
Join Podchaser to...
- Rate podcasts and episodes
- Follow podcasts and creators
- Create podcast and episode lists
- & much more
Episode Tags
Do you host or manage this podcast?
Claim and edit this page to your liking.
,Claim and edit this page to your liking.
Unlock more with Podchaser Pro
- Audience Insights
- Contact Information
- Demographics
- Charts
- Sponsor History
- and More!

- Account
- Register
- Log In
- Find Friends
- Resources
- Help Center
- Blog
- API
Podchaser is the ultimate destination for podcast data, search, and discovery. Learn More
- © 2024 Podchaser, Inc.
- Privacy Policy
- Terms of Service
- Contact Us